These examples are made with the rank (VRank) function, but may be applied in a similar manner to the HRank function. However, note that the HRank function is relevant only to pivot tables.
Example 1:
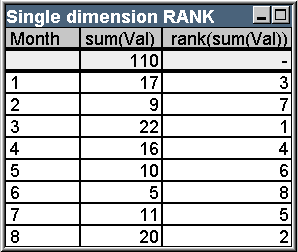
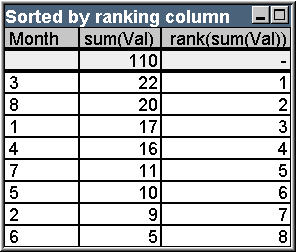
Study the two one-dimensional straight tables below:
| Month | sum(Val) | rank(sum(Val)) |
|---|---|---|
| - | 110 | - |
| 1 | 17 | 3 |
| 2 | 9 | 7 |
| 3 | 22 | 1 |
| 4 | 16 | 4 |
| 5 | 10 | 6 |
| 6 | 5 | 8 |
| 7 | 11 | 5 |
| 8 | 20 | 2 |
| Month | sum(Val) | rank(sum(Val)) |
|---|---|---|
| - | 110 | - |
| 3 | 22 | 1 |
| 8 | 20 | 2 |
| 1 | 17 | 3 |
| 4 | 16 | 4 |
| 7 | 11 | 5 |
| 5 | 10 | 6 |
| 2 | 9 | 7 |
| 6 | 5 | 8 |
The two tables are the same, but the first one is sorted by the first column while the second one is sorted by the last column. This exemplifies the basic functionality of rank. The highest value has the highest rank (lowest ranking number).
The rank function always returns NULL in total rows.
Example 2:
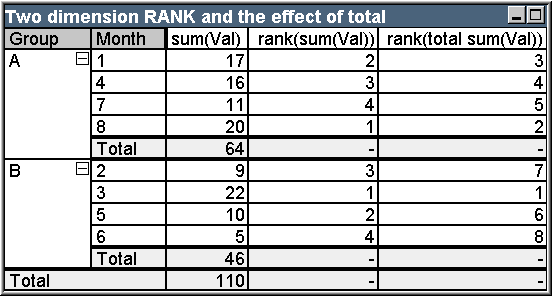
Study the two-dimensional pivot table below:
| Group | Month | sum(Val) | rank(sum(Val)) | rank(total sum(Val)) |
|---|---|---|---|---|
| A | 1 | 17 | 2 | 3 |
| A | 4 | 16 | 3 | 4 |
| A | 7 | 11 | 4 | 5 |
| A | 8 | 20 | 1 | 2 |
| A | Total | 64 | - | - |
| B | 2 | 9 | 3 | 7 |
| B | 3 | 22 | 1 | 1 |
| B | 5 | 10 | 2 | 6 |
| B | 6 | 5 | 4 | 8 |
| B | Total | 46 | - | - |
| Total | - | 110 | - | - |
This table is based on the same data as the two tables in the first example. It is now possible to see how the current column segment is the inner grouping in the multi-dimensional case. The Month field within group A is ranked separately from the Month field in group B. By introducing the total qualifier an overall ranking can again be achieved.
Example 3:
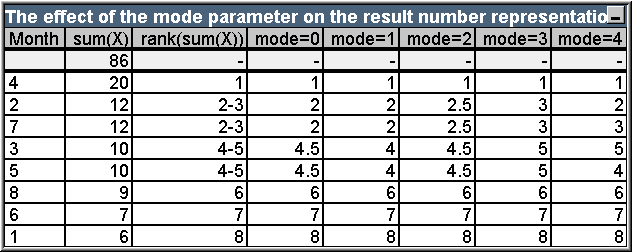
This example will demonstrate the effect of the different modes for the numeric representation of the ranking. Study the table below:
| Month | sum(X) | rank(sum(X)) | mode=0 | mode=1 | mode=2 | mode=3 | mode=4 |
|---|---|---|---|---|---|---|---|
| - | 86 | - | - | - | - | - | - |
| 4 | 20 | 1 | 1 | 1 | 1 | 1 | 1 |
| 2 | 12 | 2-3 | 2 | 2 | 2.5 | 3 | 2 |
| 7 | 12 | 2-3 | 2 | 2 | 2.5 | 3 | 3 |
| 3 | 10 | 4-5 | 4.5 | 4 | 4.5 | 5 | 5 |
| 5 | 10 | 4-5 | 4.5 | 4 | 4.5 | 5 | 4 |
| 8 | 9 | 6 | 6 | 6 | 6 | 6 | 6 |
| 6 | 7 | 7 | 7 | 7 | 7 | 7 | 7 |
| 1 | 6 | 8 | 8 | 8 | 8 | 8 | 8 |
The third column shows the ranking in text representations while column 4 - 8 shows the number representation of the same ranking in different modes. The expression in each column is:
num( rank( sum( X ), mode ))
where mode is a value from 0 to 4:
- Mode 0 (default) Rows 2 and 3 share ranking but are clearly on the lower half of the total ranking. Their number representation is therefore rounded downwards to 2. Rows 4 and 5 share ranking too, but fall just above the middle of the ranking table. Therefore they get a number representation of the average of the first and the last rank in the column ((1+8)/2=4.5). This mode is especially useful when you want to use Visual Cues to mark the data ranking highest and lowest within a group.
- Mode 1 In both cases the lower ranking figure within the group is used, i.e. 2 for rows 2 and 3, 4 for rows 4 and 5.
- Mode 2 In both cases the average of the low and high ranking within the group is used, i.e. 2.5 ((2+3)/2) for rows 2 and 3, 4.5 ((4+5)/2) for rows 4 and 5.
- Mode 3 In both cases the higher ranking figure within the group is used, i.e. 3 for rows 2 and 3, 5 for rows 4 and 5.
- Mode 4 Each row is assigned its own distinct numeric value. The order within groups sharing a ranking is determined by the sort order of the chart's dimensions.
Example 4:
This example will demonstrate the effect of the different formats for the text representation of the ranking function. Study the table below:
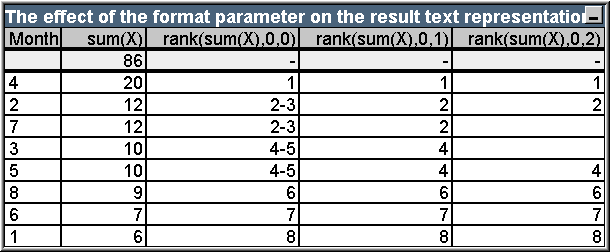
| Month | sum(X) | rank(sum(X),0,0) | rank(sum(X),0,1) | rank(sum(X),0,2) |
|---|---|---|---|---|
| - | 86 | - | - | - |
| 4 | 20 | 1 | 1 | 1 |
| 2 | 12 | 2-3 | 2 | 2 |
| 7 | 12 | 2-3 | 2 | - |
| 3 | 10 | 4-5 | 4 | - |
| 5 | 10 | 4-5 | 4 | 4 |
| 8 | 9 | 6 | 6 | 6 |
| 6 | 7 | 7 | 7 | 7 |
| 1 | 6 | 8 | 8 | 8 |
Columns 3 - 5 show the text representation of the same ranking function with different format values, where format is a value from 0 to 2:
- Format 0 (default) Rows sharing ranking are shown as 'low value - high value', e.g. '2 - 3' and '4 - 5'.
- Format 1 Rows sharing ranking always get the number of the lowest rank as text representation, in this case e.g. 2 for rows 2 and 3.
- Format 2 One row in each group sharing the same ranking gets the low rank number as text representation, while the other rows within the group get a blank string. The order within the groups sharing a ranking is determined by the sort order of the chart's dimensions.
